Business Intelligence Analytics: Real-Life Use Cases and Experiences


TLDR: We will help you to understand your data. 😊
After discussing what BI Analytics projects should look like in a series of previous articles (find them below this article), let’s now delve into the real-life implementation of these projects.
First, to achieve the best results, you must approach BI Analytics not as a one-shot project but as an ongoing process that becomes an integral part of your business, allowing for iterative improvements.
Data Analysis vs. Data Analytics
For clients who do not have experience with such projects, we prefer to guide them through 2 iterations. Those might be called Data Analysis and Data Analytics.
First, start with Data Analysis. Gather your data, process it, and present it by using BI tools. This can be done quickly and cheaply if you have a good understanding of your data and they are in decent shape.
Data analysis (basic):
⎯Present the data (data visualization or storytelling).
⎯Propose actions to take based on the data.
⎯Share data between departments.
This will help you increase the visibility of this activity throughout your organization and, once the data is available, find common ground with more stakeholders.
Second, move on to Data Analytics. Conduct advanced analyses of the data to find patterns or identify other insights, enabling you to make more informed decisions for the future. It is more complex as it addresses more intricate business questions.
⎯Data analytics (advanced):
⎯Identify trends.
⎯Discover SWOT (Strength, Weakness, Opportunity, Threat).
⎯Predict actions, triggers, or events.
⎯Make decisions (low, mid, high level of company mgt.).
Focusing on data analytics will provide reliable numbers to discuss investments rather than relying solely on intuition or subjective feelings. In today’s landscape, where low-hanging fruits are hard to find, leveraging comprehensive data is a good starting point for gathering and utilizing valuable insights.
Once Data Analytics iteration is completed, we can address and answer the following:
Uncover trends, inconsistencies, patterns, and outliers:
Peak/trough months detection:
⎯What is the remaining capacity during vacation weeks?
⎯How many seasonal workers do we need?
⎯How or when to plan vacations?
Year-to-year differences calculation:
⎯Can we cover a higher load with overtime?
⎯Is it time for new hiring?
Detection of inconsistent data:
⎯We identified errors in financial data reporting from one business unit which was overseen for months and years.
Use data visualization to present findings, predict forecasts, and propose solutions:
Identification of overloaded and underperforming departments:
⎯By continuous performance monitoring, low performance was so obvious it could not be overseen anymore, and it was addressed
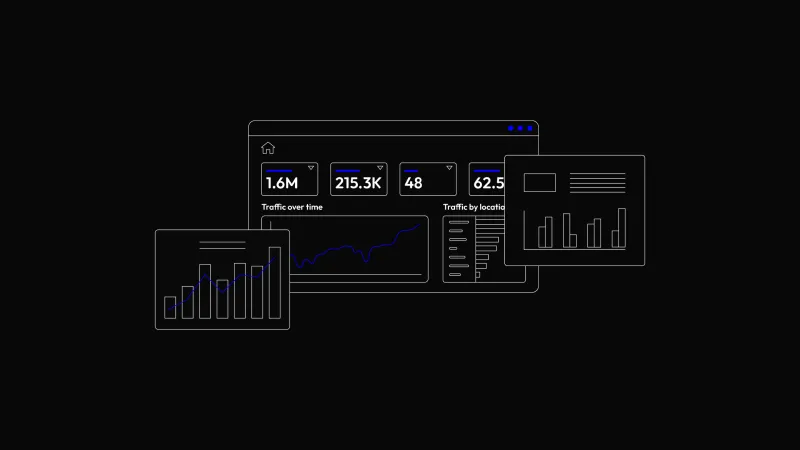
Figure 1: Basic Statistical Overview
Increase efficiency of operational processes and decrease costs by visibility:
Motivation and competition:
⎯People perform better when they know their performance is monitored and evaluated. Even better, when they believe that they will be helped when they are struggling, but that is a different topic.
⎯By comparing departments, teams, and individuals, a healthy competition was created
Save your time with data that are trusted and located at hand:
⎯Data are transparent, visible for all, and available at the right time, whether it is every morning at 7:00 for stand-up meeting or 16:30 for a customer report
Sensitivity and security:
⎯With Row Level Security, only people with authorization will see sensitive data, if there are such
Accurately track sales, marketing, production, or financial performance:
The company learns from the past for better planning of the future:
⎯Can we reduce the material delivery lead time?
⎯Can we adjust project plans to other projects/production processes?
⎯How much can be invested every month?
Actual Cashflow Overview:
⎯Can we make such an investment without additional funding this month or do we need to wait 2 months?
Tracking your SLAs, KPIs, or Customer satisfaction:
⎯Do we respond in time?
⎯Does our response time correlate with customer satisfaction rating?
⎯Do we hit the target for the month?
⎯Do we finish the project on time and within budget?
⎯Are we improving a little every month or do we improve in big steps?
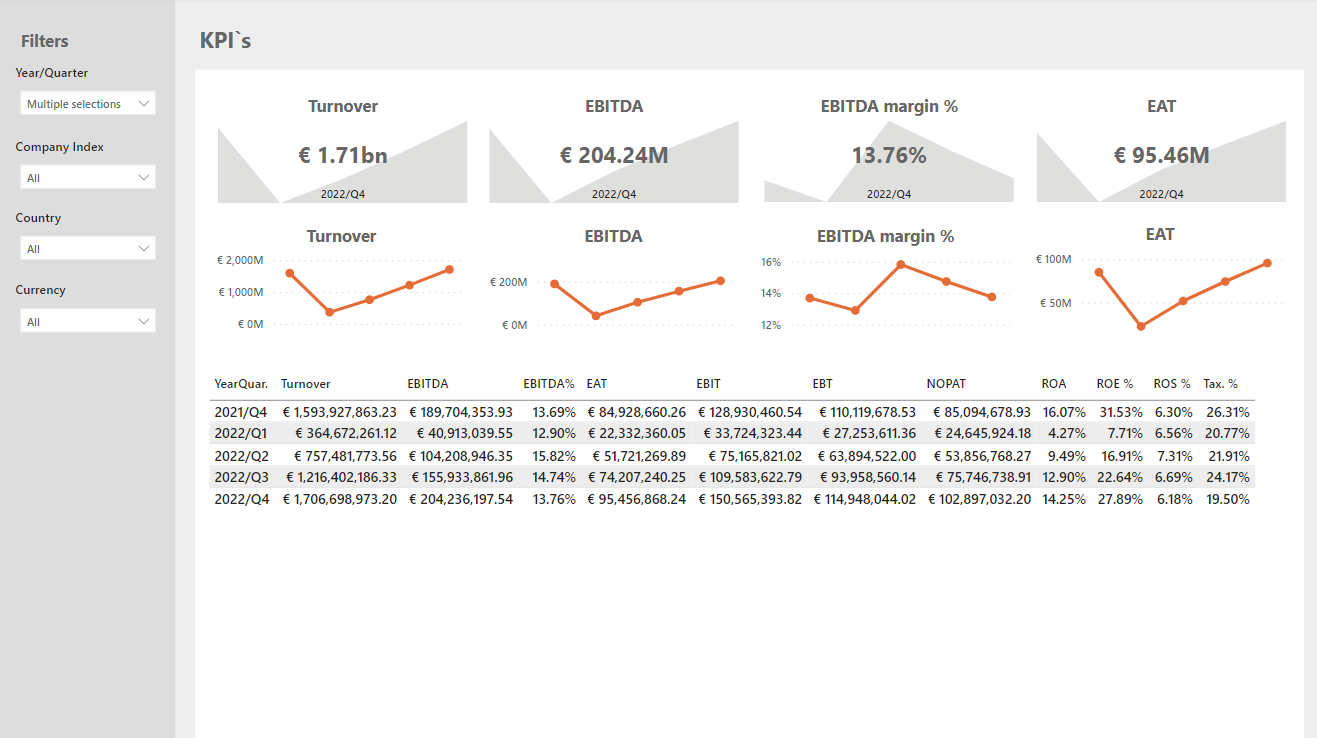
Figure 2: KPI Overview
Create clear benchmarks based on historical and current data:
Comparison between you and your competitors:
⎯Do we finish work faster than the industry average?
⎯How many more orders do we get after we perform a specific change in the process?
Stock capacity
⎯Can we fit all the incoming goods into the available storage space, do we need to extend it by 20% or 50%?
⎯Following the trend, do we need to order this item already, or shall we order more to prevent shortage during peak months?
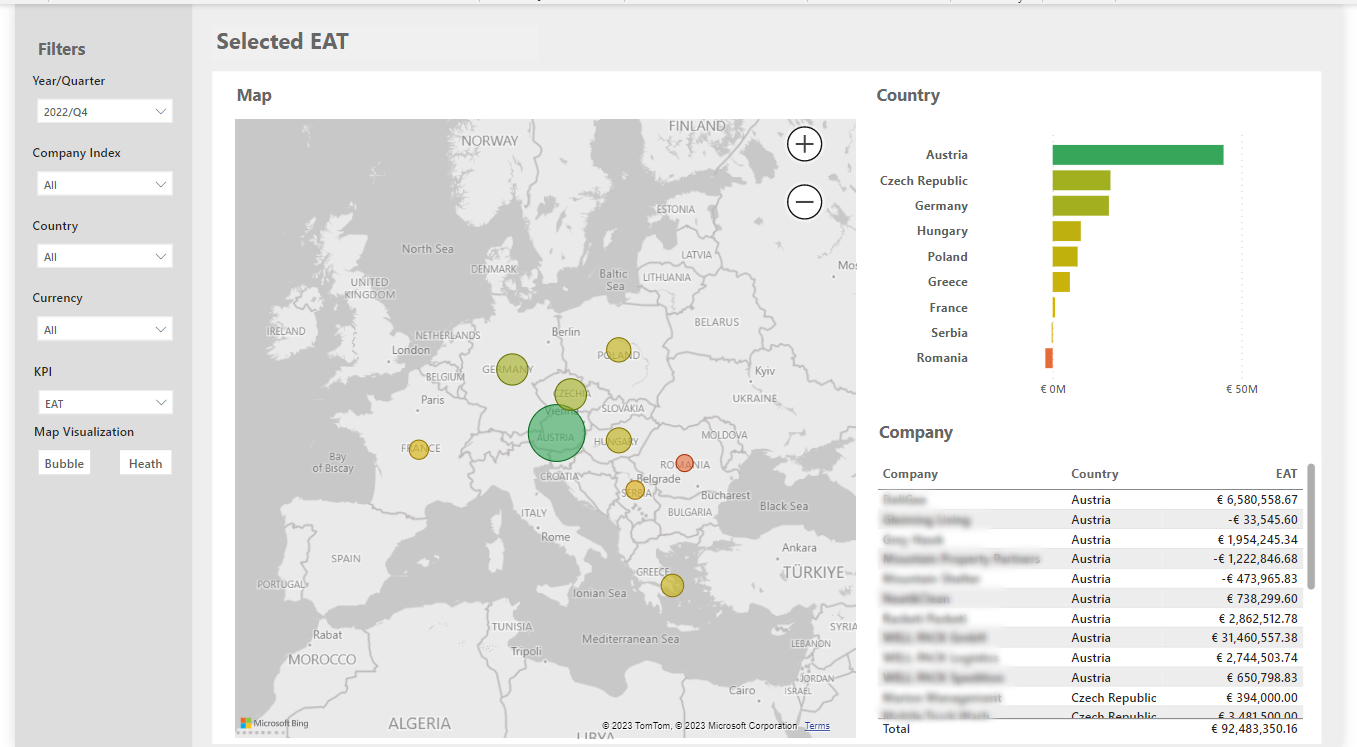
Figure 3: Geographic Distribution for KPIs
Authors:
Tomas Kavicky
Identification & Valuation Manager and a huge fan of Data Science, BI, MS Power Platform, and Six Sigma Principles,
Lukas Lani
Project Manager, technically based, open-thinking with strong analytical skills.
_____________________________________